Orford Close Ely, East Cambridgeshire
18 addresses across 1 postcode (CB7), about 80 m long, classed as a local road. USRN 12004089.
- Sales: 31 recorded sales since 1995; in 2026 the median was £330,000 across 1 sale.
- Energy: 17 homes have an energy certificate (C: 17).
- Flood: No address on its postcodes is in an area at high or medium risk of flooding from rivers, the sea or surface water.
- Council tax: Most homes around it are in council tax band C; Band D in East Cambridgeshire costs £2,485 a year in 2026-27.
- Broadband: Gigabit broadband is available to 100% of premises.
- Transport: The nearest railway station is Ely, about 2.2 km away in a straight line.
- Green space: The nearest park or garden, Ely Common, is about 240 m away.
- Air: Background air pollution in 2024 was 5.7 µg/m³ of nitrogen dioxide and 7.1 of PM2.5, within UK legal limits.
- Height: Its addresses are 10 to 12 m above sea level.
- Noise: 2 of its 18 addresses are modelled at 55 dB or more from road traffic.
- Doctors: The nearest GP surgery is Cathedral Medical Centre, about 820 m away.
- People: About 390 people lived in the census areas around it in 2021; 69% of households owned their home and 52% of adults held a degree or other higher qualification.
- Crime: 36 crimes were recorded within 250 m between September 2025 and August 2026, most often violence and sexual offences.
Sales on this street
| Year | Sales | Median price | Lowest | Highest |
|---|---|---|---|---|
| 2026 | 1 | £330,000 | £330,000 | £330,000 |
| 2025 | 2 | £302,500 | £215,000 | £390,000 |
| 2021 | 3 | £305,000 | £284,000 | £310,000 |
| 2020 | 3 | £305,000 | £240,000 | £325,000 |
| 2018 | 1 | £195,000 | £195,000 | £195,000 |
| 2017 | 1 | £190,300 | £190,300 | £190,300 |
| 2016 | 1 | £230,000 | £230,000 | £230,000 |
| 2015 | 1 | £238,000 | £238,000 | £238,000 |
| 2014 | 3 | £189,950 | £165,000 | £242,500 |
| 2013 | 1 | £210,000 | £210,000 | £210,000 |
| 2012 | 9 | £195,495 | £154,000 | £214,995 |
| 2010 | 5 | £225,000 | £169,000 | £229,995 |
| Date | Address | Type | Price | Notes |
|---|---|---|---|---|
| 6 Jan 2026 | 1 CB7 4LX | Semi-detached | £330,000 | |
| 1 Dec 2025 | 11 CB7 4LX | Flat or maisonette | £215,000 | Leasehold. |
| 5 Feb 2025 | 15 CB7 4LX | Terraced | £390,000 | |
| 17 Dec 2021 | 7 CB7 4LX | Terraced | £305,000 | |
| 14 Jun 2021 | 1 CB7 4LX | Semi-detached | £284,000 | |
| 25 Mar 2021 | 17 CB7 4LX | Terraced | £310,000 | |
| 18 Dec 2020 | 14 CB7 4LX | Terraced | £240,000 | |
| 21 Sep 2020 | 6 CB7 4LX | Terraced | £305,000 | |
| 10 Feb 2020 | 15 CB7 4LX | Terraced | £325,000 | |
| 28 Mar 2018 | 9 CB7 4LX | Flat or maisonette | £195,000 | Leasehold. |
| 31 Mar 2017 | 4 CB7 4LX | Flat or maisonette | £190,300 | Leasehold. |
| 15 Sep 2016 | 14 CB7 4LX | Terraced | £230,000 | |
| 16 Sep 2015 | 1 CB7 4LX | Semi-detached | £238,000 | |
| 16 Oct 2014 | 3 CB7 4LX | Flat or maisonette | £165,000 | Leasehold. |
| 20 Aug 2014 | 12 CB7 4LX | Semi-detached | £189,950 | |
| 1 Aug 2014 | 6 CB7 4LX | Terraced | £242,500 | |
| 29 Apr 2013 | 17 CB7 4LX | Terraced | £210,000 | |
| 30 Nov 2012 | 11 CB7 4LX | Flat or maisonette | £154,375 | New build. Leasehold. |
| 19 Oct 2012 | 10 CB7 4LX | Flat or maisonette | £154,375 | New build. Leasehold. |
| 29 Jun 2012 | 7 CB7 4LX | Terraced | £214,995 | New build. |
| 29 Jun 2012 | 6 CB7 4LX | Terraced | £214,000 | New build. |
| 29 Jun 2012 | 5 CB7 4LX | Terraced | £209,995 | New build. |
| 29 Jun 2012 | 8 CB7 4LX | Terraced | £200,000 | New build. |
| 22 Jun 2012 | 2 CB7 4LX | Semi-detached | £177,660 | New build. |
| 25 May 2012 | 1 CB7 4LX | Semi-detached | £195,495 | New build. |
| 23 Mar 2012 | 3 CB7 4LX | Flat or maisonette | £154,000 | Leasehold. |
| 29 Oct 2010 | 12 CB7 4LX | Semi-detached | £172,000 | New build. |
| 13 Oct 2010 | 17 CB7 4LX | Terraced | £225,000 | New build. |
| 5 Aug 2010 | 18 CB7 4LX | Terraced | £229,000 | New build. |
| 30 Jun 2010 | 15 CB7 4LX | Terraced | £229,995 | New build. |
| 30 Jun 2010 | 14 CB7 4LX | Terraced | £169,000 | New build. |
Energy performance certificates
17 homes with a current certificate; median floor area 81 m². Most common: House, semi-detached (4); Flat (4); House, end-terrace (4). Built: 2010 (5); 2007-2011 (4); 2012 onwards (3). Tenure at assessment: owner-occupied (7); rented (private) (4).
Council tax
What each band costs in East Cambridgeshire in 2026-27: Band D £2,485 a year on average, including the police, fire and any county and parish charges.
| A | B | C | D | E | F | G | H |
|---|---|---|---|---|---|---|---|
| £1,657 | £1,933 | £2,209 | £2,485 | £3,037 | £3,590 | £4,142 | £4,970 |
Homes by band in the neighbourhood around this street: most are in band C (25% of about 830 homes).
Planning and heritage
- Conservation area: no postcode centre in this street's postcodes is in one.
- Listed buildings on or by this street: none.
- Article 4 direction (removing permitted development rights): none recorded, though not every council has published theirs.
- Tree preservation orders: none recorded, though not every council has published theirs.
- Green belt: no.
Brownfield land registered for housing within 1.0 km
- 5-8 Simeon Close Ely Cambridgeshire CB7 4RU: up to 4 homes, permissioned (740 m)
- Princess of Wales Hospital, Lynn Road, Ely CB6 1DN, not permissioned (790 m)
- Princess of Wales Hospital, Lynn Road, Ely CB6 1DN: up to 77 homes, not permissioned (790 m)
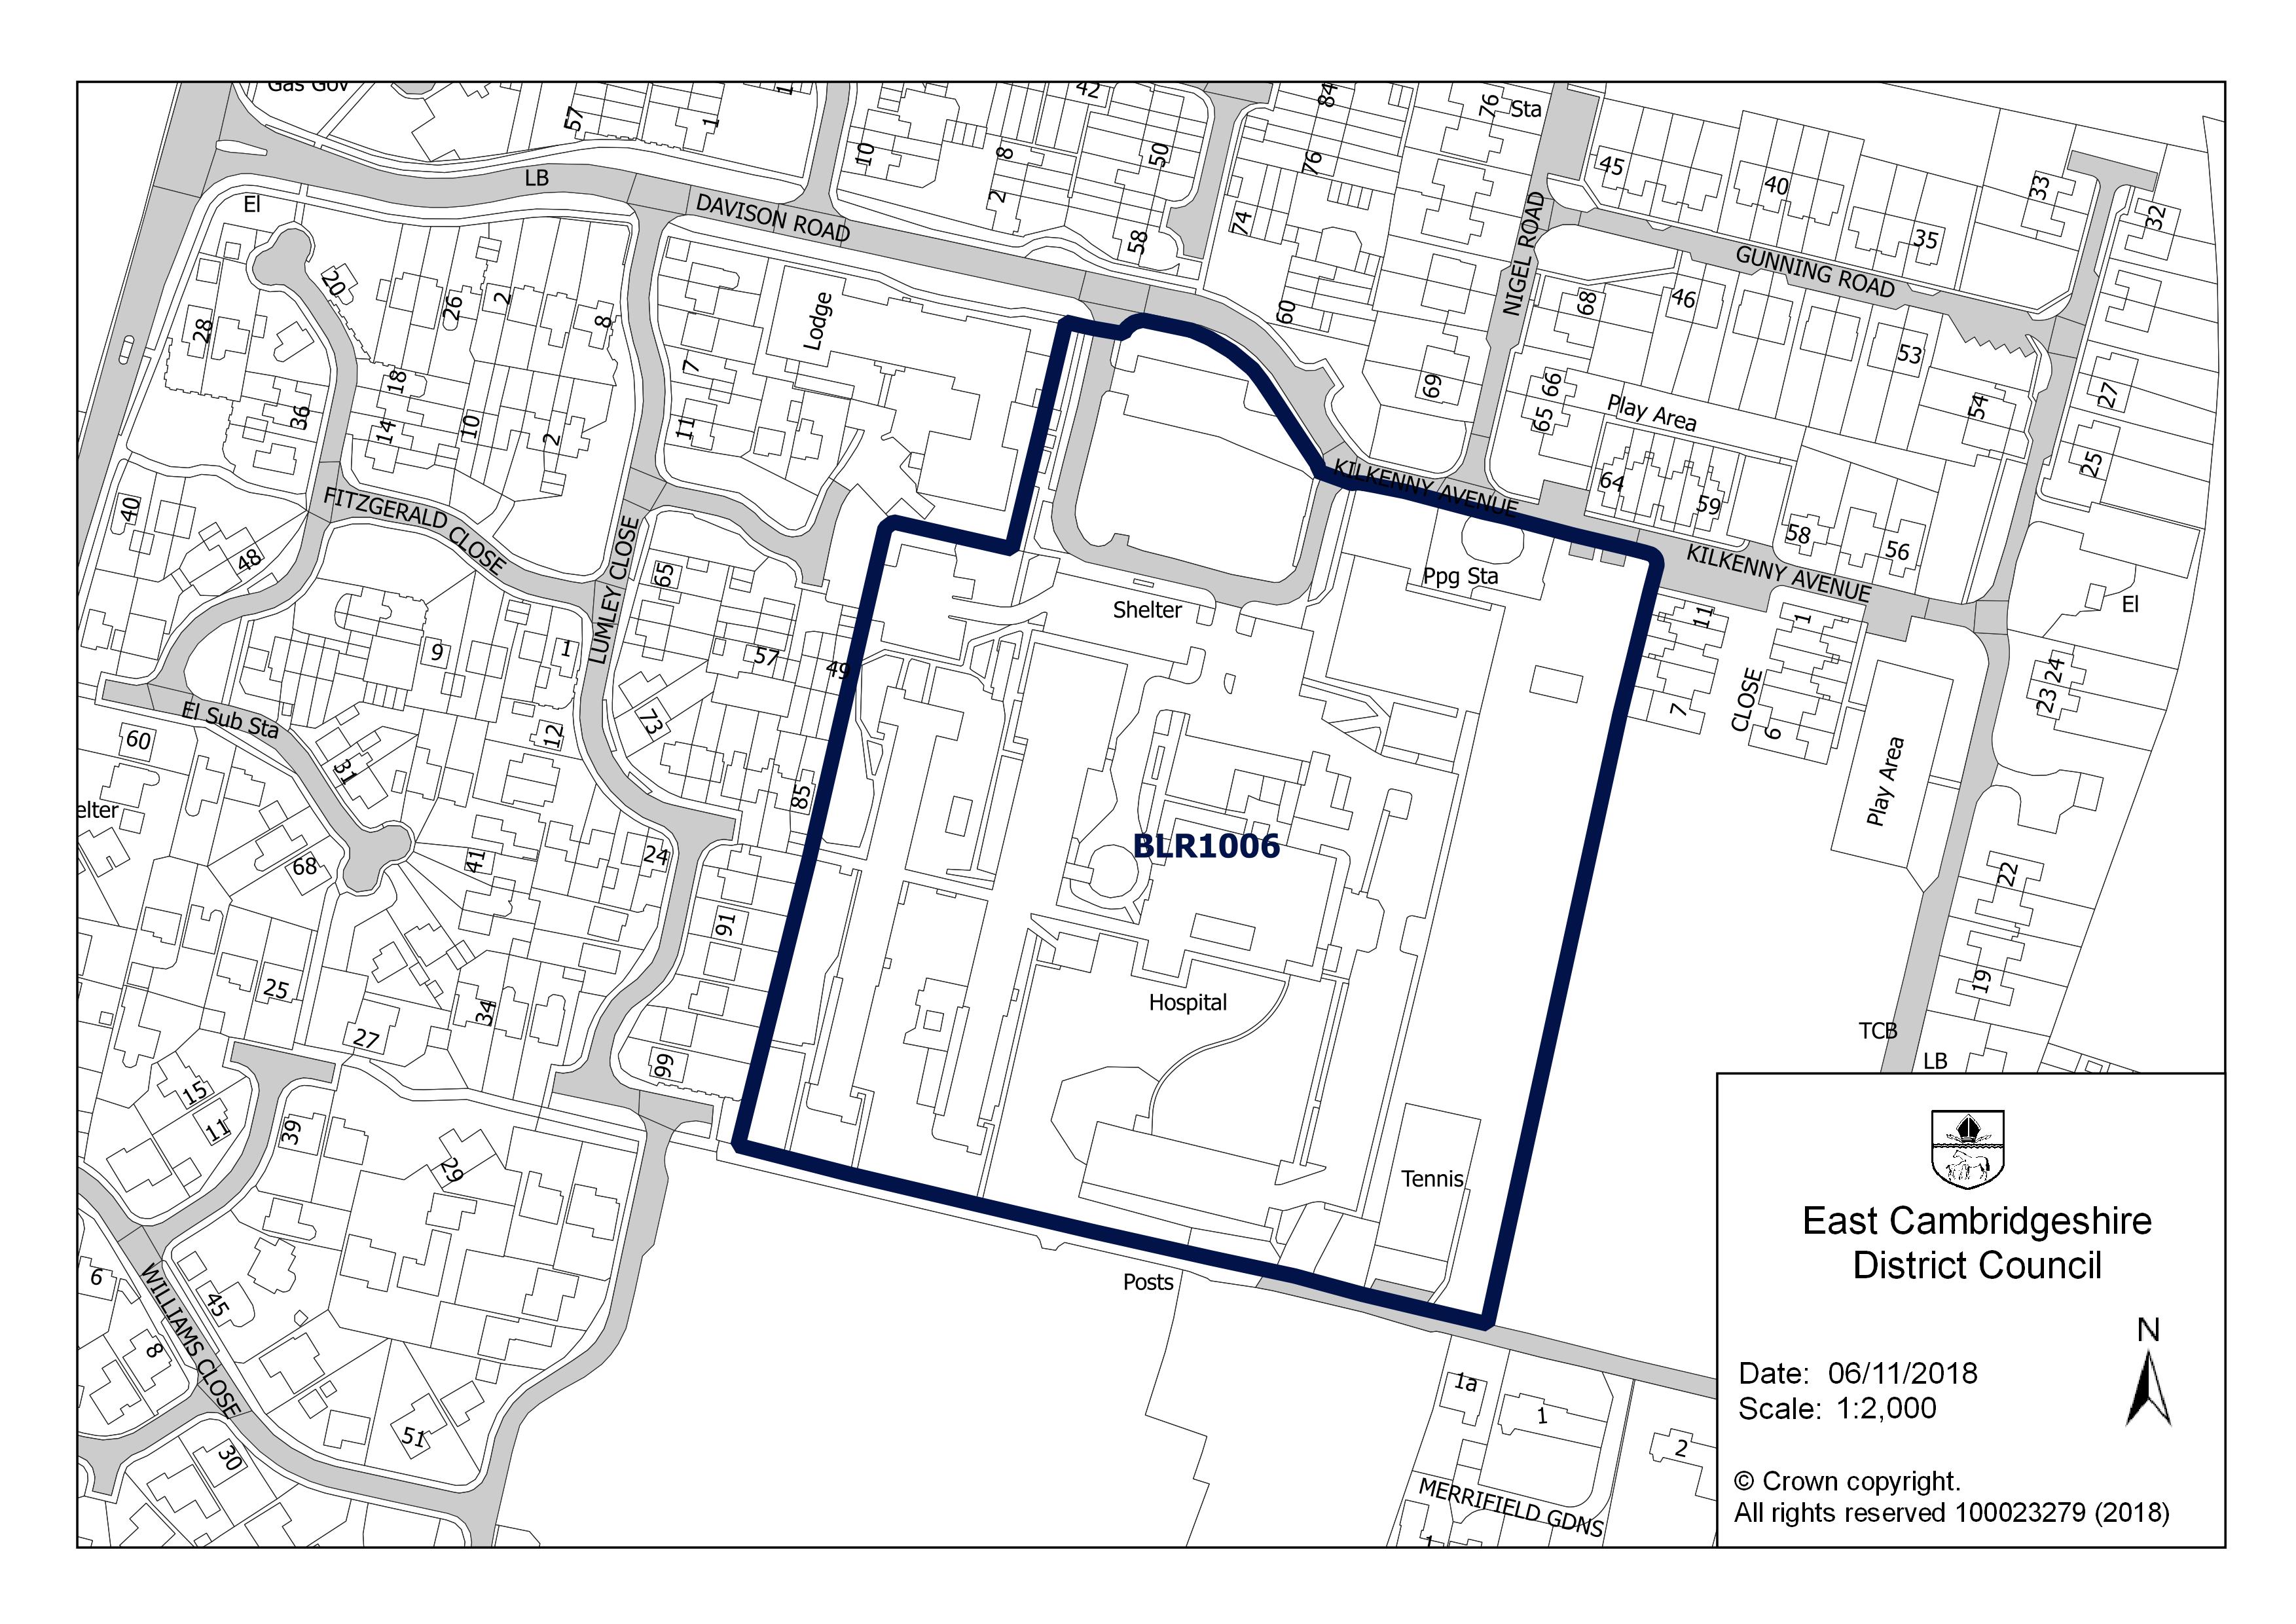
Roadworks
No street works under way, planned or finished in the last three months on this street, in permits up to 30 September 2026.
Flood risk
Rivers, the sea or surface water: in this street's postcodes, 0 addresses are in areas at high risk, 0 at medium risk and 2 at low risk. Each address counts once, at the higher of its rivers-and-sea and surface-water risk.
Rivers and the sea alone: no home is in an area at risk.
High: 3.3% (1 in 30) or more chance of flooding a year. Medium: 1% to 3.3%. Low: 0.1% to 1%. Very low: under 0.1%. The rivers and sea figures allow for flood defences. Counts cover whole postcodes, which can include other streets.
Flood zone for planning: no postcode centre is in flood zone 2 or 3.
Height above sea level
The street's 18 addresses are between 10 m and 12 m above sea level (11 m on average).
Broadband
| Postcode | Superfast (30 Mbit/s+) | Ultrafast (300 Mbit/s+) | Gigabit | Below 10 Mbit/s |
|---|---|---|---|---|
| CB7 4LX | 100% | 100% | 100% | 0% |
Getting around
| Nearest | Distance | |
|---|---|---|
| Railway stations | Ely 2.3 million journeys in 2024–25 | 2.2 km |
| Littleport 252,000 journeys in 2024–25 | 6.5 km | |
| Soham 66,000 journeys in 2024–25 | 8.7 km | |
| Bus stops | 4 stops within 400 m, 13 within 800 m; nearest Longchamp Drive Ely | 100 m |
| Car parks | Fishermans Car Park | 1.4 km |
| EV charging points | 3 within 1.6 km; nearest Newnham Street Car Park | 1.3 km |
| Airport with scheduled flights | London Stansted Airport STN | 58.2 km |
Local services
| Nearest | Distance | |
|---|---|---|
| GP surgeries | 1 practices within 1.6 km; nearest Cathedral Medical Centre | 820 m |
| Pharmacies | 2 pharmacies within 1.6 km; nearest Wellbeing Pharmacy | 820 m |
| NHS dentists | 1 practices within 1.6 km; nearest Lynn Road (Dental Surgery) | 820 m |
| Hospital | Princess Of Wales Hospital | 820 m |
| Police station | Ely Police Station | 1.5 km |
| Cash machines | Cashpoint® Minster Place Lloyds Bank | 1.7 km |
Parks and green space
| Nearest | Distance | |
|---|---|---|
| Park or garden | 1 within 800 m; nearest Ely Common 3.2 ha | 240 m |
| Play area | 2 within 800 m; nearest Unnamed 1,010 m² | 700 m |
| Playing field | 1 within 800 m; nearest Unnamed 5,710 m² | 700 m |
| Allotments | 1 within 800 m; nearest New Barns Avenue Allotments 1.1 ha | 590 m |
Within 800 m: 1 park or garden, 3.2 hectares in all.
Landmarks
The nearest historic landmark is Ely Cathedral: claustral buildings, a scheduled monument, 1.7 km south-west.
| Name | What it is | From the middle of the street |
|---|---|---|
| Ely Cathedral: claustral buildings | Scheduled monument | 1.7 km south-west |
| 'Cherry Hill', castle mound | Scheduled monument | 1.9 km south-west |
| Name | What it is | From the middle of the street |
|---|---|---|
| Roswell Pits | Lake or reservoir | 460 m south |
| Redmoor Plantation | Wood | 2.0 km north |
| Quanea Hill | Hill | 2.4 km south-east |
| Brick Hill | Hill | 2.8 km north |
| Thorney Hill | Hill | 3.0 km south-east |
| The Rookery | Wood | 3.4 km south-east |
Air quality
| Pollutant | Here | UK limit | WHO guideline |
|---|---|---|---|
| Nitrogen dioxide (NO2) | 5.7 | 40 | 10 |
| Fine particles (PM2.5) | 7.1 | 20 | 5 |
| Particles (PM10) | 12.4 | 40 | 15 |
All three are within the UK legal limits; PM2.5 is above the WHO guideline, as in most towns and cities.
Road and rail noise
| Level | Road traffic | Railways |
|---|---|---|
| 55 to 59 | 2 | 0 |
| Under 55 | 16 | 18 |
2 of the street's 18 addresses are modelled at 55 dB or more from road traffic, above the WHO guidelines.
Nearest schools
| School | Phase | Ages | Distance | Inspection |
|---|---|---|---|---|
| Ely St Mary's CofE Junior School Church of England | Primary | 7–11 | 420 m | Good (Apr 2023, overall grade under the previous framework) |
| Spring Meadow Infant School | Primary | 4–7 | 480 m | Good (Mar 2024, overall grade under the previous framework) |
| Isle of Ely Primary School | Primary | 3–11 | 1.3 km | No published inspection |
| Lantern Community Primary School | Primary | 3–11 | 1.6 km | No published inspection |
| Ely College | Secondary | 11–18 | 1.8 km | No published inspection |
Food hygiene ratings nearby
| Business | Type | Distance | Rating | Rated |
|---|---|---|---|---|
| Cathedral View Childcare Ltd CB7 4GQ | Hospitals/Childcare/Caring Premises | 160 m | 5 Very good | 23 Jun 2026 |
| Play-Station After School Club CB7 4RB | Hospitals/Childcare/Caring Premises | 420 m | 5 Very good | 21 Feb 2022 |
| Caterlink @ Ely St Mary's Cof E Junior School CB7 4RB | School/college/university | 420 m | 5 Very good | 26 Nov 2025 |
Crime within 250 m
| Category | Crimes |
|---|---|
| Violence and sexual offences | 13 |
| Criminal damage and arson | 8 |
| Anti-social behaviour | 7 |
| Public order | 4 |
| Drugs | 1 |
| Theft from the person | 1 |
| Other theft | 1 |
| Other crime | 1 |
Most of these are attached to: On or near Allen Road (15); On or near Park/Open Space (8); On or near Merivale Way (5); On or near Allix Way (4); On or near Turner Drive (3).
People and work
Who lives here
| Around this street | England | |
|---|---|---|
| Median age | 36 | 40 |
| Children under 15 | 22% | 17% |
| Aged 65 and over | 5% | 18% |
Homes
| Around this street | England | |
|---|---|---|
| Owned (outright or with a mortgage) | 69% | 61% |
| Owned outright | 15% | 33% |
| Shared ownership | 5% | 1% |
| Social rented | 7% | 17% |
| Private rented | 19% | 21% |
Work and commuting
| Around this street | England | |
|---|---|---|
| Adults (16 and over) in work | 81% | 57% |
| Unemployment (of those working or looking for work) | 2% | 6% |
| Retired (of adults) | 6% | 22% |
| Long-term sick or disabled (of adults) | 2% | 4% |
| Work mainly from home (of those in work) | 43% | 32% |
| Travel to work by car or van | 42% | 48% |
| By train, Underground, metro or tram | 3% | 4% |
| By any public transport, including bus | 3% | 8% |
| On foot or by bicycle | 9% | 10% |
| Work within 10 km of home (of those who travel to work) | 47% | 65% |
| Work 30 km or more away | 7% | 8% |
Education and languages
| Around this street | England | |
|---|---|---|
| Degree or other higher qualification, Level 4+ (of adults) | 52% | 34% |
| No qualifications | 9% | 18% |
| Apprenticeship as highest qualification | 4% | 5% |
| Main language English (aged 3 and over) | 88% | 91% |
| Cannot speak English well or at all | 1% | 2% |
Deprivation
The neighbourhood around this street is in decile 10 of 10 on the English Indices of Deprivation 2025, where 1 is the most deprived tenth of England's 33,755 neighbourhoods and 10 the least.
What has changed
Nothing new since the change feed started on 30 October 2026. New sales and energy certificates, and hygiene ratings, school inspections and flood figures nearby, will be listed here as the sources update.
Postcodes on this street
- CB7 4LX: 18 addresses
Nearby streets
Allen Road · Turner Drive · Merivale Way · Allix Way · Summerhayes · Longchamp Drive · Cleopatra Close · Skipper Walk · Prickwillow Road · Henley Way · Monarch Way · Brimstone Drive
All the streets in CB7 and across East Cambridgeshire.
What this page cannot tell you
- Whether a particular house is at risk of flooding, subsiding or anything else: the flood map is a model of areas and there is no property-level data here.
- What a home is worth now: sales are historic prices for the homes that happened to sell.
- How safe the street is: crime points are moved to anonymised locations and many crimes are never reported.
- Whether you would get a place at a school: distances are straight lines, not catchments.
- Who lives on the street now: census figures describe the small areas around it in March 2021, during a lockdown.
- How long a journey takes or how often anything runs: transport distances are straight lines to the nearest stops.
- Whether a GP practice is taking new patients, or a dentist new NHS patients.
- How loud a home is inside, or noise from aircraft, industry or neighbours: noise figures are models of road and rail traffic outside, in England only.
How each figure on this page is matched to the street and worked out: methodology.